| Encounters | Processing Status | Mission Bulletins | Mission Image Archive | References | Related Links | Mercury Gazetteer | MESSENGER Mission |
| Geometry | Radiometry |
Geometry
Geometrically controlled mosaics are now complete (and, in the process, reconstructed camera pointing information) for the Mariner 10 first encounter incoming and outgoing imaging sequences at a resolution of 1-2 km. This control net includes over 800 Mariner 10 frames, and was produced in cooperation with M. Davies and T. Colvin (RAND).
To correct geometric distortions introduced by electrostatic and magnetic focusing systems the two Mariner 10 cameras each had a grid of 111 metallic reseaux deposited on the inside surface of the vidicon. The position of each reseau on the vidicon was recorded to within 0.001 mm [Benesh and Morrill, 1973]. Utilizing these pre-launch measurements and our subsequent measurements of the locations of the reseaux found in the images of Mercury, the Mariner 10 frames can be geometrically rectified. The positions of the reseaux in the Mercury images vary from frame-to-frame due to changes in scene brightness and exposure level. Areas of high contrast, such as a bright limb against the space background, often show the worst reseau position discrepancies from the nominal locations. Additionally, we found that the location of the reseaux changed by more than 5 pixels from the first encounter (March 29, 1974) to the second encounter (September 21, 1974) for portions of each vidicon. This may be due to the fact that the onboard camera heater failed for the second encounter, thus the vidicons were at a lower temperature [Murray and Burgess, 1977]. Utilizing close approach images of Mercury that were transmitted with a low data rate [Danielson et al., 1975], thus relatively high signal-to-noise-ratio, we derived nominal reseau positions for each camera for each encounter (total of six nominal position files). Utilizing the FINDRX program (an autocorrelation program) within the ISIS software package [USGS, 1998], and adjusting parameters specifically for Mariner 10, the reseau locations were automatically found in each image utilizing the nominal locations as the correlation starting point. The majority of Mariner 10 high resolution images were sent back in real time (117.6 Kbits/s) with an attendant increase in bit errors during transmission [Danielson et al., 1975; Soha et al., 1975]. This resulted in severe salt and pepper random noise [Soha et al., 1975] that hampers the automatic identification of reseaux, especially in areas with low signal such as terminator regions and space. Due to the generally noisy nature of the data [Danielson et al., 1975; Soha et al., 1975] tolerances were set high (0.90 correlation) to help avoid spurious reseau identifications. Failure to find an actual reseau at a given position resulted in default to the nominal position for a given camera/encounter combination.
From the original control point measurements [Davies et al., 1976] and the new reseau positions (for each image) an initial run of the analytical triangulation revealed that some control points had large residuals relative to the average. Inspection of suspect points showed that some of the original measurements contained crater misidentifications, and these points were thrown out. We also noted that some images had a high percentage of bad points, and it was found that reseau misidentification had occurred. These problem images were inspected and the reseau locations were measured manually. A second iteration of the analytical triangulation resulted in improved residuals. Again, bad points were deleted and reseaux were located manually on problem images in preparation for a third run.
The final analytical triangulation contains 10,704 measurements of 2306 points from 811 images acquired during the three Mariner 10 encounters. The overdetermination in the new control net is 3.04, and was calculated according to the following equation.

Where N is the number of measurements, M is the number of images, and N is the number of points. The standard measurement error is 0.00844 mm (0.6 pixels). Mercury’s radius was assumed to be 2439 km except where occultation data and radar measurements give more precise values. As part of the analytical triangulation new values for the focal length of each camera were derived (Camera A 1493.6 mm, camera B 1500.1 mm).
The control network of Mercury is computed using the J2000 coordinate system that is defined by the FK5 star catalog and has the standard epoch of J2000 January 1.5 (JD 2451545.0), TDB. The spin axis of Mercury is normal to its orbital plane and its rotation is 3/2 synchronous with the Sun [Pettengill and Dyce, 1965; Klaasen, 1975]. The direction of the north pole is specified by the value of its right ascension (µ 0) and declination (d 0). The location of the prime meridian is specified by the angle W that is measured along Mercury’s equator in an easternly direction with respect to its north pole from the node of Mercury’s equator on the standard equator, to the point where the prime meridian crosses Mercury’s equator [Davies et al., 1996]. The IAU/IAG/COSPAR Working Group on Cartographic Coordinates and Rotational Elements of the Planets and Satellites [Davies et al., 1996a] publishes a report every three years updating tables that give definitions of the current best estimates of the directions of the north poles and equations that define the prime meridians of the planets and satellites. Thus, the new equation for W is

where the constant term (W0) ensures that the longitude of the crater Hun Kal is at 20 longitude in the control network [Davies et al., 1996b]. The positions of both the north and south poles are shifted approximately 1° in latitude from that shown in previous maps (Davies et al., 1978).
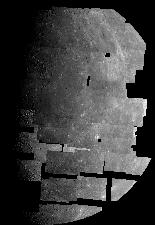
Geometric Control Mosaic
Click here for a larger image.
This mosaic shows one step in the process of creating a geometrically seamless mosaic (see incoming mosaic, outgoing mosaic). Here only images critical to defining the base map are shown—brightness differences between frames are intentionally left in the images. This aids in locating seam boundaries and spotting problems in the geometric control (frame-to-frame registration).
2nd Encounter Southern Hemisphere Mosaic
Click here for a larger image.
When Mariner 10 passed by Mercury for the second it went in front of the planet, in the soutern hemispohere and acquired hundreds of images. Currently about 150 of these images have been assembled into a cotrolled mosaic seen here. Eventually the gores in the mosaic will be filled with images from the first encounter.
Radiometry
A set of clear filter mosaics is being compiled in such a way as to maximize the signal-to-noise ratio of the data and to allow for a quantitative measure of the precision of the data on a pixel-by-pixel basis.
Three major imaging sequences of Mercury were acquired by Mariner 10: incoming first encounter (centered at 20S, 2E), outgoing first encounter (centered at 20N, 175E), and southern hemisphere second encounter (centered at 40S, 100E). For each sequence we are making separate mosaics for each camera (A and B) in order to have independent measurements. For each mosaic, regions of overlap from frame to frame are being averaged and the attendant standard deviations are being calculated.
Due to the highly redundant nature of the data, each pixel in each mosaic will be an average calculated from 1-10 images. Each mosaic will have a corresponding standard deviation and n (number of measurements) map. A final mosaic will be created by averaging the six independent mosaics. This procedure lessens the effects of random noise and calibration residuals.
From these data an albedo map will be produced using an improved photometric function for the Moon [McEwen, 1996]. A similar procedure is being followed for the lower resolution color sequences (UV, blue, orange, UV polarized). These data will be calibrated to absolute units through comparison of Mariner 10 images acquired of the Moon and Jupiter. Spectral interpretation of these new color and albedo maps will be presented with an emphasis on comparison with the Moon.
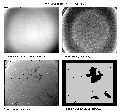
Radiometric Processing Steps
Click here for a larger image.
Images are calibrated by combining data derived before launch in the lab
and after launch. Dark signal is removed from each image (images acquired
in space), and linearity and system non-uniformity is modeled with
prelaunch flat field images. Vidicon blemishes are identified from bland
images of venusian clouds from which a stencil is made and applied to the
mercurian frames.
Images per pixel Average Count
Click here for a larger image.
Warmer colors represent larger number of images at a given location within the mosaic.


